
Pipeline Integrity Visualisation in Maps
Real-Time Pipeline Intelligence on an Interactive GIS Platform
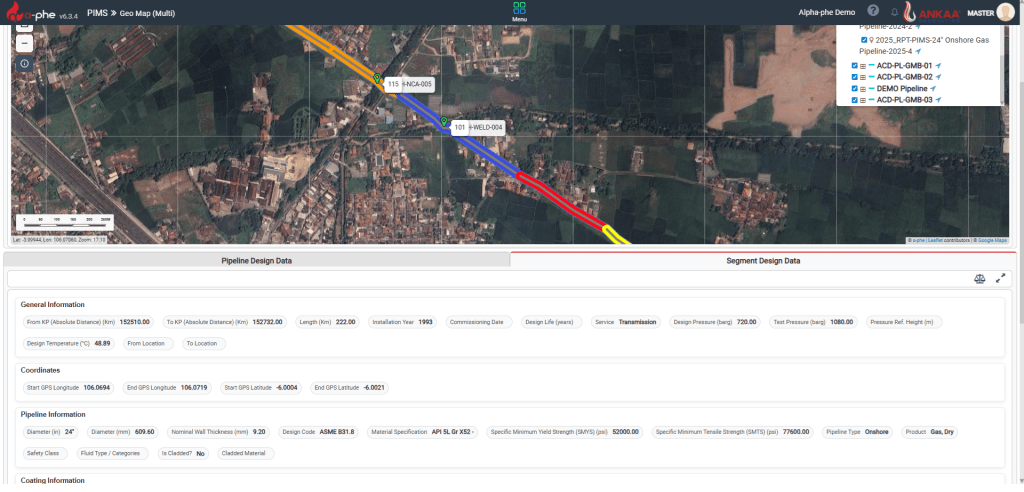
The α-phe PIMS Map View provides a powerful, real-time spatial visualisation of your entire pipeline network. It transforms engineering data, inspection results, risk levels, anomalies and integrity assessments into a clear, interactive geospatial interface. Operators gain immediate visibility of pipeline conditions across onshore, offshore and facility environments, enabling faster, more informed integrity decisions.
Designed specifically for pipeline operators, the α-phe Map View integrates GIS intelligence, RBI outputs, inspection results, anomaly data, and FFS assessments into one unified visual system.
Comprehensive Pipeline Route Visualisation
The α-phe PIMS module automatically plots each pipeline using recorded GPS coordinates, KP (Kilometre Point) markers and segmentation attributes.
Key Features:
- Displays full onshore and offshore pipeline routes
- GPS-driven plotting of start/end points, bends, crossings and facilities
- Auto-generated segmentation overlay (onshore, offshore, riser, subsea, facility tie-ins)
- Integrated kilometre posts (KP) for quick reference
- Multi-pipeline and multi-product network display
This ensures that engineers have absolute clarity on the geography, environment and alignment of every pipeline in the network.
Risk-Based Integrity Status Overlays
GIS map layers visually present the results of the α-phe PIMS RBI Engine.
Visualised Integrity Parameters:
- Probability of Failure (PoF)
- Consequence of Failure (CoF)
- Combined Risk Ranking (Low, Medium, High, Critical)
- Confidence/uncertainty factors
- Threat prioritisation (corrosion, 3rd-party damage, geohazards, vibration, etc.)
Segments are colour-coded based on their current risk state, enabling rapid identification of high-risk zones requiring immediate attention.
Inspection Status & Activity Tracking
Users can toggle layers to view inspection activities across the full pipeline lifecycle.
GIS Inspection Layers:
- ILI Runs: MFL, UT, Caliper and Geo-pig inspection paths
- CP Surveys: CIPS and DCVG survey locations
- UT Wall Thickness Survey Points
- Close Visual Inspection Points (CVI)
- Coating Condition and Holiday Detection
- Environmental and Soil Characterisation Points
- Suspension Bridge, Road, Rail, River and Sea Crossings
Each inspection data point can be clicked to open full details, photos, readings and linked assessments.
Real-Time Defect & Anomaly Visualisation
The map dynamically displays all anomalies captured through ILI, UT, CVI, CP or other inspections.
GIS-Visible Anomalies Include:
- Metal loss defects
- External corrosion hotspots
- Internal corrosion indicators
- Dents, gouges, buckles and ovality
- Cracks or crack-like anomalies (if applicable)
- Coating damages
- CP failures or low-potential regions
- Free-span zones
- Geohazard-prone locations (land movement, flooding, subsidence)
Each anomaly is represented with a unique symbol or colour, and clicking on it reveals:
- Exact GPS location
- Defect type, dimensions and growth rate
- Inspection method/source
- Assessment notes
- Associated FFS/remaining life output
- Assigned actions and repair status
Fitness-for-Service (FFS) Results on the Map
All FFS evaluation results are fully visualised on the map, allowing engineers to see integrity status spatially.
FFS Layers Include:
- Metal loss assessment outcomes (acceptable / monitor / repair)
- Burst pressure and remaining strength results
- MAOP validation zones
- Dents and buckle severity ranking
- Free-span acceptability (stable / unstable / re-inspect)
- ICDA and ECDA assessment outcomes
- Remaining-life distribution across segments
Each FFS output is presented spatially, linked back to the exact defect or pipeline segment.
Configurable Layers & Filters
Advanced filtering allows engineers to customise the map:
- Filter by pipeline, segment, product or operator
- Filter by risk level
- Filter by inspection type or year
- Filter by anomaly severity
- Filter by FFS status
- Toggle on/off categories (CP, ILI, UT, CVI, defects, threats)
This ensures the map adapts to your operational or engineering needs.
Ideal for Multi-Pipeline, Multi-Asset Organisations
The α-phe GIS system supports:
- Multiple pipelines across multiple countries
- Thousands of kilometres of pipeline data
- High-consequence area monitoring
- Offshore & subsea infrastructure
- Facilities, riser sections and subsea tie-ins
- Operations requiring frequent inspection and integrity cycles
It is designed for operators who need a scalable and intuitive visualisation tool.
Benefits of α-phe PIMS Map Visualisation
- Immediate integrity awareness
- Enhanced situational decision-making
- Faster root-cause evaluation
- Early identification of high-risk areas
- Improved planning of inspections and repairs
- Direct link between GIS and FFS/RBI outputs
- Full integration with α-phe AIMS, RBI and CMMS
- Reduced manual mapping and Excel/GIS dependency
Experience the Power of Intelligent Integrity Visualisation
The α-phe PIMS Map View transforms your entire pipeline network into an interactive integrity dashboard.
Request a demonstration to see how α-phe provides superior visibility, safety and operational efficiency.
Request for free Demo / Quote
Schedule a 30 minute to 1hr call
In the 30-minute to 1hr call we will demonstrate the software and explain the concept around the software, we will clarify all the queries you may have. The demo will be scheduled over Microsoft Teams. The link to connect will be provided after reviewing the submission of the request for free demo form below.